My wife and I are looking at getting a used compact EV, comparing various local listings for cars, such as Kia Niro EV, Chevrolet Bolt, Hyundai Kona Electric, Kia Soul EV, or Nissan Leaf (but probably not the Leaf1 😂). There are some listings with a good price, some with low mileage, some with longer EV range, some located close to us, while other listings have an even better price, but are located in adjacent cities a few hours away. My wife really wants a small car, and having remote start is essential for Canadian winters; a heat pump is also preferred to save range on those cold days. AI Generated image about creating Weighted Normalization Value Score for Used EV shopping (Created by Google Gemini)
So how do you decide which used car is the best overall value for you?
I wanted to come up with a way to organize the listed vehicles that are on my radar, and determine which ones are the best overall value, with the attributes most important to us. This "Value Score" should take into account multiple attributes and apply a weighted normalization or multi-crieteria decision analysis (MCDA) algorithm to each attributes weighted according to how important they are to us.
Organizing the Data in Google Sheets
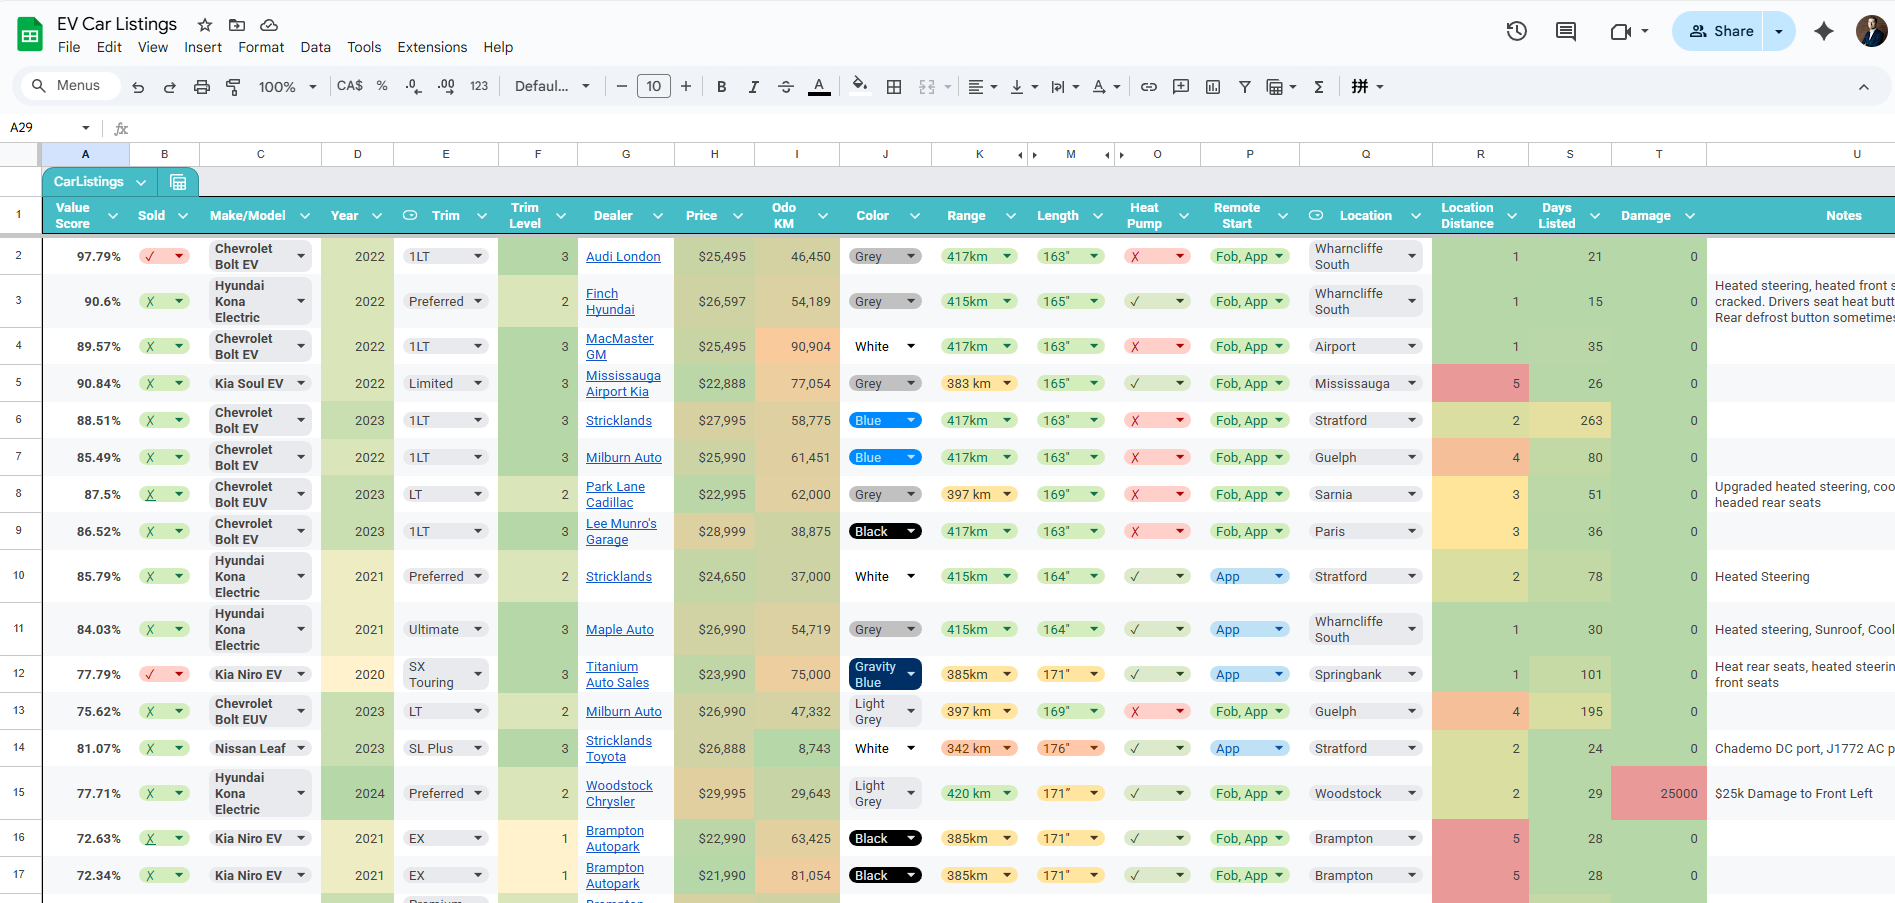
I created a Google Sheet of all the relevant dealership listings I found, so I could share with my wife. Google recent added Data Tables to Sheets, and you can have Dropdown's for nice tidy data validation in each column - I made use of this for almost every column, except for Price, Odo KM.
My Data looks like this (Table name = CarListings):
Make/Model
Year
Trim
Trim Level
Dealer
Price
km
Color
Range
Length
Heat Pump
Remote Start
Location
Days Listed
Distance
Damage
Chevrolet Bolt EUV
2023
LT
1
Park Lane Cadillac
$22,995
62,000
Grey
397 km
169"
✗
Fob, App
Sarnia
36
4
0
Kia Niro EV
2020
SX Touring
3
Titanium Auto Sales
$23,990
75,000
Gravity Blue
385km
171"
✓
App
Springbank
86
1
0
Hyundai Kona Electric
2021
Preferred
1
Stricklands
$24,650
37,000
White
415km
164"
✓
Fob, App
Stratford
63
2
0
Chevrolet Bolt EV
2022
1LT
3
MacMaster GM
$25,495
91,000
White
417km
163"
✗
Fob, App
Airport
20
1
0
Chevrolet Bolt EV
2022
1LT
3
Audi London
$25,495
46,450
Grey
417km
163"
✗
Fob, App
Wharncliffe South
6
1
0
Nissan Leaf
2023
SL Plus
3
Stricklands Toyota
$26,888
8,743
White
342 km
176"
✓
App
Stratford
9
2
0
Hyundai Kona Electric
2021
Ultimate
3
Maple Auto
$26,990
55,000
Grey
415km
164"
✓
Fob, App
Wharncliffe South
15
1
0
Hyundai Kona Electric
2024
Preferred
1
Woodstock Chrysler
$29,995
29,643
Grey
420 km
171"
✓
Fob, App
Woodstock
14
2
25000
Hyundai Kona Electric
2021
Ultimate
3
London Airport Hyundai
$32,995
70,000
Red
415km
164"
✓
Fob, App
Airport
383
1
0
Kia Niro EV
2024
Wind+
2
Milton Kia
$33,995
30,683
Grey
407km
174"
✓
Fob, App
Milton
74
5
0
Kia Niro EV
2023
Premium Plus
2
401 Dixie Kia
$29,998
51,336
Grey
407km
174"
✓
Fob, App
Mississauga
97
5
0
Kia Niro EV
2021
EX
1
Brampton Autopark
$21,990
81,054
Black
385km
171"
✓
Fob, App
Brampton
13
5
0
Notes:
Trim Level is a hidden calculated columns with VLOOKUP from separate sheet Trim Lookup, to assign a numerical value based on the relative trim level - e.g. 2020 Kia Niro EV comes in 3 trim levels EX, EX+, and SX Touring; I assign 1 to EX, 2 to EX+, and 3 to SX Touring so I can weight the Trims =IFERROR(INDEX(FILTER(TrimLevel[Trim Level], (TrimLevel[Trim]=E2)*(TrimLevel[Make/Model]=C2)), 1), "No Match")
Distance calculated columns with VLOOKUP from separate sheet Distance Lookup, to assign a numerical value based on the relative distance I'm willing to travel to buy a car. - e.g. 1 for same city, 2 for close by town, 3-5 for other cities within 2 hours. =IFERROR(VLOOKUP(CarListings[Location],DistanceLookup,2,FALSE),999)
For Days Listed, I have a calculated column that calculates the number of days between when the Listing was first posted to today, e.g. =TODAY()-DATE(2025,11,12) = 7 days
Trim Lookup
Here is my "Trim Lookup" table (in its own sheet), which is used to build the Make/Model and Trim data validation dropdowns on the main table, and calculate the Trim Level value. The Trim Level is a number between 1 to 3 (could be higher if there are more Trims for a particular model) to differentiate the more expensive, feature-rich trims (higher number) vs the more basic trims (lower number), and give us a common comparison across different makes and models.
Make/Model
Trim
Trim Level
Chevrolet Bolt EUV
LT
2
Chevrolet Bolt EUV
Premier
3
Chevrolet Bolt EV
1LT
3
Chevrolet Bolt EV
1LT
3
Hyundai Kona Electric
Preferred
2
Hyundai Kona Electric
Ultimate
3
Hyundai Kona Electric
Essential
1
Kia Niro EV
SX Touring
3
Kia Niro EV
EX
1
Kia Niro EV
Premium+
2
Kia Niro EV
Wind+
2
Kia Niro EV
Wave
3
Kia Niro EV
Limited
3
Kia Niro EV
EX+
2
Kia Niro EV
Premium
1
Nissan Leaf
SL Plus
3
Nissan Leaf
SL
2
Nissan Leaf
SV Plus
1
Kia Soul EV
Limited
3
Kia Soul EV
Premium
2
Distance Lookup
Here is my "Distance Lookup" table (in its own sheet), which is used to build the Location data validation dropdown on the main table, and calculate the Distance value. A lower number is closer (e.g. 1 is in-town), whereas a higher number is farther.
Location
Distance
Springbank
1
Airport
1
Wharncliffe South
1
Stratford
2
Woodstock
2
Sarnia
3
Paris
3
Guelph
4
Milton
5
Mississauga
5
Brampton
5
Problem with Sorting in Google Sheets
Although you can sort your table by one or more columns, (Price ascending, then Odo ascending) I felt the order wasn't giving me a true representation of my most preferred vehicles in the list. I wanted to sort them in a more holistic way, to truly rank the listings on my preferences.
Create Weights Lookup Sheet
We need a sheet that has the weights we assign to each attribute, so we can easily and dynamically update them as needed. Create a new sheet called "Weights Lookup". Add a row for each column you want to consider in your Value Score. Here are my weights, and I converted the data into a Table named WeightsValue.
Column
Weight
Price
35%
Odo
16%
Range
12%
Year
10%
Trim Level
10%
Distance
10%
Remote Start
10%
Length
10%
Damage
5%
Heat Pump
5%
Total
123%
Note: It is ok if the total is more than 100% (they aren't really a %, more of a relative amount).
Adding Weighted Normalized Value Score
Create a Insert a new column called Value Score (I put mine to the left of all others). The formula should look up attributes from each row and do some calculations as to its rank and apply our Weights from the WeightsValue table. It also has IFERROR to protect from Divide-By-Zero errors. The formula:
Explanation of Attributes and Weighted Normalized Formula:
Here is an explanation of my attributes and how they are used in the formula:
Price: Lower is best(MAX(CarListings[Price])-CarListings[Price])/(MAX(CarListings[Price])-MIN(CarListings[Price]))*VLOOKUP("Price",WeightsValue,2,FALSE)
Price is the most important attribute, but not the only thing I want to consider... I am willing to pay a bit more if the value and other attributes align with what I want. I am only considering vehicles under $35,000 in my search.
Formula takes the difference between the price for a listing and the MAX price in the column, divided by the range in prices, multiplied by our Price Weighting (0.35)
Odometer: Lower is best(MAX(CarListings[Odo KM])-CarListings[Odo KM])/(MAX(CarListings[Odo KM])-MIN(CarListings[Odo KM]))*VLOOKUP("Odo",WeightsValue,2,FALSE)
Odometer is the second most important attribute, indicating how much "wear and tear" is on the vehicle. I am only considering vehicles under 100,000km in my search.
Formula takes the difference between the Odo for a listing and the MAX Odo in the column, divided by the range in Odos, multiplied by our Odo Weighting (0.16)
Range: higher is best(CarListings[Range (km)]-MIN(CarListings[Range (km)]))/(MAX(CarListings[Range (km)])-MIN(CarListings[Range (km)]))*VLOOKUP("Range",WeightsValue,2,FALSE)
For Range, I am only considering vehicles with > 300km range (This should ensure being able to go at least 200km on a single trip without charging, even in winter). Honest take: I may have weighted this attribute a bit higher than I actually wanted, for the sole reason that the Nissan Leaf (which had the worst range) was rated lower 😏1
Note: Since I included the units in the Range column, it is text not numeric; so I created a hidden Range (km) helper calculated column that takes just the numeric value from the Range column =IF(ROW()=1,"Range_Numeric",VALUE(REGEXEXTRACT(CarListings[Range],"[0-9]+")))
Formula takes the difference between the Range for a listing and the MIN Range in the column, divided by the range in Range, multiplied by our Range Weighting (0.12)
Year: higher is best(CarListings[Year]-MIN(CarListings[Year]))/(MAX(CarListings[Year])-MIN(CarListings[Year]))*VLOOKUP("Year",WeightsValue,2,FALSE)
I am willing to pay a bit more for a newer vehicle, as they should last longer and have more modern features. I am only considering vehicles from the past 5 years.
Formula takes the difference between the Year for a listing and the MIN Year in the column, divided by the range in Year, multiplied by our Year Weighting (0.10)
Trim Level: higher is best(CarListings[Trim Level]-MIN(CarListings[Trim Level]))/(MAX(CarListings[Trim Level])-MIN(CarListings[Trim Level]))*VLOOKUP("Trim Level",WeightsValue,2,FALSE)
Distance: lower is best(MAX(CarListings[Distance])-CarListings[Distance])/(MAX(CarListings[Distance])-MIN(CarListings[Distance]))*VLOOKUP("Distance",WeightsValue,2,FALSE)
I am willing to drive up to 2 hours to save, if it means I am getting significantly better value. There are sometimes great deals in the Greater-Toronto-Area, which is about 2 hours away; this is a hastle, but worth it to save a few thousand dollars 🤑. I am only considering vehicles within a 2 hour drive.
Formula uses the hidden helper Distance column (with lookup from Distance Lookup table), and takes the difference between the Distance for a listing and the MAX Distance in the column, divided by the range in Distance, multiplied by our Distance Weighting (0.1)
Heat Pump: true is bestIF(CarListings[Heat Pump]="✓",1,0)*VLOOKUP("Heat Pump",WeightsValue,2,FALSE)
I didn't weight Heat Pump very high, since the only models without Heat Pumps were the Chevy Bolts, but they also have a bit more Range to make up for it.
Formula: Here we need to convert our cool checkmark ✓ boolean symbols into numeric 1 or 0, so we can multiply them by our Heat Pump Weighting (0.05).
Length: lower is best(MAX(CarListings[Length (Inches)])-CarListings[Length (Inches)])/(MAX(CarListings[Length (Inches)])-MIN(CarListings[Length (Inches)])),0)*VLOOKUP("Length",WeightsValue,2,FALSE)
Length was not weighted very high, since we're only considering compact models, but included it since it was an attribute that varied between models, and my wife really wanted a small car. Honest take: I may have weighted this attribute a bit higher than I actually wanted, for the sole reason that the Nissan Leaf (which was the longest) was rated lower 😏1
Formula takes the difference between the Length for a listing and the MAX Length in the column, divided by the range in Lengths, multiplied by our Length Weighting (0.10)
Although this Value Score helps me to have a great way to sort my Google Sheet Car Listings in the preferred way, it isn't perfect. I don't take into account maintenance costs, warranty information, dealership reputation. Additionally, my weighting is subjective, based on my personal preferences (which is not necessarily bad, since this is for my personal benefit).
Footnotes:
1 There are a few reasons that The Leaf is not my preferred EV. In my opinion:
It is a bit ugly, compared to the other sleek models
At 176", it is the longest of the compact EVs
It has a history of poor battery degradation
It uses a legacy CHAdeMO port for DC charging, which is slower and has less support than CCS
About the Author:
Ted Martin
Ted currently works as a Data Engineer on the Database Operations Team at CARFAX Canada.
Ted is an enthusiastic, outside-the-box thinker, who masters new skills or technologies extremely quickly. Like many Data Professionals, his career path was not straight-cut. Ted started programming and building websites at the bright age of 12, and built his first database at age 16 (all self-taught). He studied at Western University (Ontario, Canada) with an Honours Degree in the Medical Sciences.
To gain a greater global perspective, Ted spent 2 years traveling and studying overseas at in China. Before finding his calling working in Data, he banked a few years’ experience in Retail Sales Management and Business Development, giving him a balanced mind on both the business and technology side of solving problems.
This article is a continuation of "Where's the Metadata?", focusing on obtaining Metadata from a Relational Database Management Systems (RDMS). I will co…
What is "Metadata"? Essentially it is data about data... It is the data that describes the characteristics, structure, categories, quality, origin, and usage of your data, helping to put it in it…
Have you gone into an auto part shop to find a certain part for your car? Even something as simple as wiper blades have hundreds of different types, with 99% of them being the one you don't want fo…


 Reading time: 23 minutes
 Reading time: 8 minutes
 Reading time: 8 minutes